
Albuquerque Investment Property Analysis: Cap Rate, Cash-on-Cash Return, and ROI
How do you calculate cap rate, cash-on-cash return, and ROI on an Albuquerque investment property?
To analyze any Albuquerque investment property, you need three core metrics: Cap Rate (NOI divided by purchase price), Cash-on-Cash Return (annual pre-tax cash flow divided by total cash invested), and ROI (total gains including equity and appreciation divided by total investment).
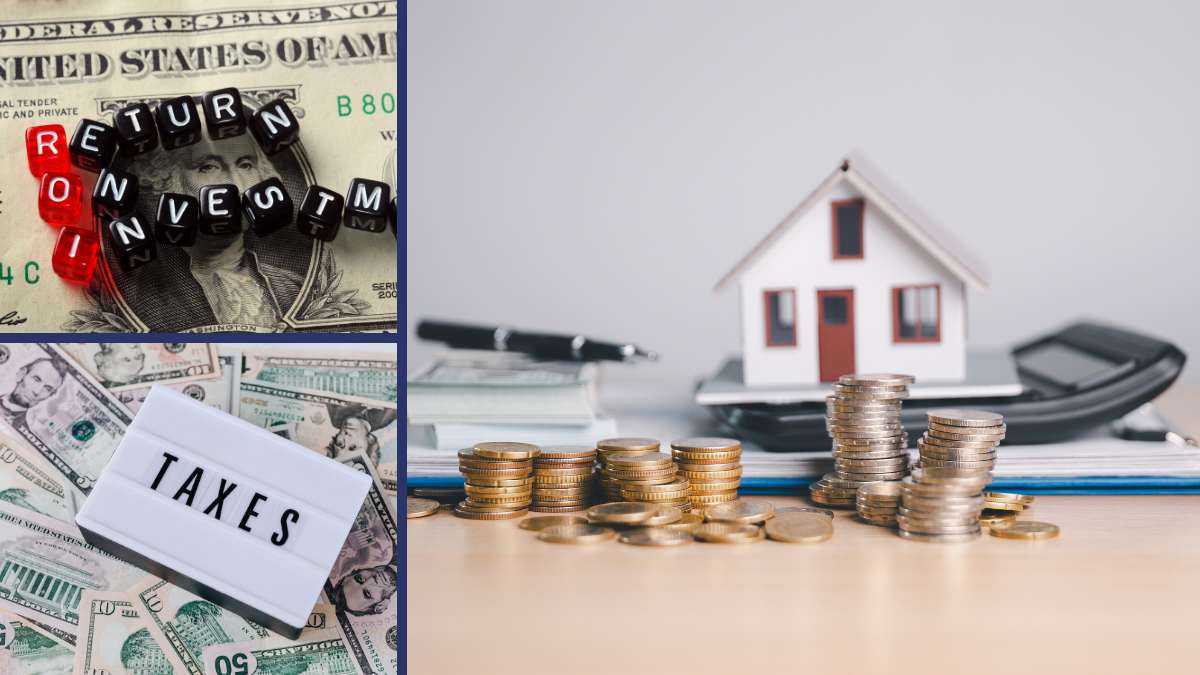
Why Albuquerque Investment Property Analysis Matters Right Now
If you are a distressed homeowner in Albuquerque, you might feel like your options are limited. But here is the thing: the same property that feels like a burden could be someone else's next investment, and understanding how investors evaluate properties can empower you to make better decisions about selling, holding, or even repositioning your home as a rental.
With Albuquerque's median sale price sitting at $386,000 as of July 2026 and median rents at $1,310 per month, the math on investment properties tells a very specific story. Single-family cap rates in Albuquerque average 5.5% to 6.5%, and cash-on-cash returns hover around 8%. Those numbers make this market one of the stronger cash-flow metros in the Southwest. Whether you are considering selling to an investor, converting your property to a rental, or evaluating your equity position, knowing how to run these numbers puts you in control.
We have spent 12 years helping Albuquerque homeowners navigate exactly these situations. So let us walk you through the math.
How to Calculate Cap Rate on an Albuquerque Property
Cap Rate is the simplest way to compare investment properties without worrying about financing. It measures your unlevered return, meaning it shows what the property earns on its own, regardless of how you pay for it.
The formula is straightforward: Net Operating Income (NOI) divided by Purchase Price.
What does that look like in a real Albuquerque neighborhood? Let us break it down with a Nob Hill example.
Nob Hill Cap Rate Scenario
- Purchase Price: $420,000 (typical for homes near Central Avenue and Carlisle Blvd)
- Monthly Rent: $1,700 (Nob Hill's median, the highest of any tracked Albuquerque neighborhood)
- Annual Gross Rent: $20,400
- Estimated Annual Operating Expenses: Property taxes at 0.67% ($2,814), insurance ($1,600), maintenance at 1.5% ($6,300), vacancy at 7% ($1,428), property management at 9% ($1,836). That totals roughly $13,978.
- NOI: $20,400 minus $13,978 equals $6,422
- Cap Rate: $6,422 divided by $420,000 equals approximately 5.3%
That sits near the lower end of Albuquerque's 5.5% to 6.5% range, which makes sense because Nob Hill commands premium pricing due to its walkability, proximity to UNM, and thriving Central Avenue corridor with spots like M'tucci's Bar Roma and Kei & Molly Textiles. You are paying more upfront, but tenant demand is strong and vacancies tend to be short.
So what does this mean for you? If an investor approaches you about buying your Nob Hill property, now you can see the math from their side, and negotiate accordingly.
How to Calculate Cash-on-Cash Return in Albuquerque
Cap rate is helpful for comparing deals, but Cash-on-Cash Return shows you what your actual out-of-pocket dollars are earning. This is the metric that tells investors whether a deal makes sense *for them personally*, because it accounts for financing.
The formula: Annual Pre-Tax Cash Flow divided by Total Cash Invested.
Southeast Albuquerque Cash-on-Cash Scenario
Southeast Albuquerque remains one of the most affordable areas in the city, with entry points in the mid-$200,000s to low $300,000s. Here is how the math works for a financed purchase:
Purchase Price: $275,000
Down Payment (25%): $68,750
Closing Costs (estimated 3%): $8,250
Total Cash Invested: $77,000
Monthly Rent: $1,350
Annual Gross Rent: $16,200
Annual Operating Expenses: approximately $10,060 (taxes, insurance, maintenance, vacancy, management)
Annual Mortgage Payment: approximately $9,936 (based on a $206,250 loan at roughly 6.5%)
Annual Pre-Tax Cash Flow: $16,200 minus $10,060 minus $9,936 equals a negative $3,796
Wait. That is actually negative? This is exactly why we tell our clients to run Cash-on-Cash before Cap Rate. A property can look attractive on a cap rate basis but underperform once debt service enters the picture, especially at today's mortgage rates in the 6% to 7% range.
One couple we worked with recently was considering keeping their Southeast Albuquerque home as a rental rather than selling it during a tough financial stretch. When we ran the cash-on-cash numbers together, they realized the property would cost them roughly $300 per month out of pocket after expenses and mortgage. Selling and capturing their equity turned out to be the better play, and they walked away with enough to stabilize their finances and start fresh.
How to Calculate Total ROI on Albuquerque Investment Properties
ROI gives you the full picture. While cap rate ignores financing and cash-on-cash ignores equity growth, ROI accounts for *everything*: cash flow, mortgage paydown, and property appreciation.
The formula: (Total Gains divided by Total Cash Invested) times 100.
North Valley ROI Example Over Five Years
North Valley properties along Rio Grande Blvd NW and near 4th Street NW can range from $350,000 to well above $700,000. Let us use a mid-range scenario:
Purchase Price: $400,000
Total Cash Invested (25% down + closing): $112,000
Annual Cash Flow (after all expenses and debt): $1,800
5-Year Cash Flow Total: $9,000
Mortgage Paydown Over 5 Years: approximately $18,500
Appreciation at 4% annually for 5 years: approximately $86,700
Total 5-Year Gain: $9,000 + $18,500 + $86,700 = $114,200
5-Year ROI: $114,200 divided by $112,000 = approximately 102%
That is a total return of more than 100% on your cash invested over five years, even with modest cash flow. Albuquerque's continued housing shortage (estimated at 13,000 to 28,000 homes below demand) supports the appreciation assumption, and prices are expected to see continued moderate growth of 3% to 5% annually.
Having closed over 250 transactions in the Albuquerque market, we can tell you that the ROI calculation is where most investors either get excited or walk away. It is also where distressed homeowners often discover they have more leverage than they thought.
What Albuquerque Neighborhoods Offer the Strongest Investment Returns
Not all Albuquerque neighborhoods pencil out the same way. Your returns depend heavily on the price-to-rent ratio, and that varies block by block.
Best Neighborhoods for Albuquerque Cap Rates
Downtown (ZIP 87102): Lowest median home value at $241,332 paired with median rents near $1,310 creates some of the strongest gross yields in the city, though older properties carry higher maintenance costs.
Southeast Albuquerque: Entry-level homes in the mid-$200,000s provide favorable price-to-rent ratios for investors who handle property management themselves.
Nob Hill: Higher purchase prices but the city's strongest rents at $1,700 per month. Cap rates near 5.3% to 5.8% with extremely low vacancy risk thanks to walkability and proximity to UNM.
Why This Matters If You Are a Distressed Homeowner
A seller we helped last year had fallen behind on payments on a three-bedroom near Candelaria Rd NW in North Valley. They assumed no one would want the property because it needed work. But when we positioned it to the investor market and showed how the numbers worked (the combination of below-market purchase price and North Valley rental demand near $1,633 per month), we received three offers within 10 days. The seller avoided foreclosure and preserved their credit.
Why Working With Local Experts Changes Your Albuquerque Investment Outcome
Running the formulas is the easy part. The hard part is knowing which numbers to plug in, and that requires local expertise.
For example, Albuquerque's market operates at two distinct speeds right now. Well-priced, well-presented homes in desirable areas sell in under two weeks with multiple offers. Meanwhile, overpriced or dated properties can sit for 60 to 90 days. Buyers in the $400,000 to $550,000 range are negotiating an average of 3.7% below asking price, roughly $17,800 on a $480,000 home.
Those dynamics directly affect your cap rate and ROI assumptions. If you are buying, that negotiation margin improves your returns. If you are selling, understanding investor math helps you price correctly the first time.
With 20 five-star reviews and a 5/5 average rating from our clients, we pride ourselves on giving you straight answers backed by real data. As one past client put it: "Vinay was absolutely fantastic, explained everything taking me from start to finish. No question unanswered."
That is exactly the approach we bring to investment analysis: no question unanswered, every number accounted for.
Frequently Asked Questions About Albuquerque Investment Property Analysis
What is a good cap rate for Albuquerque rental properties?
Single-family cap rates in Albuquerque typically average 5.5% to 6.5%. Anything above 6% is considered strong for the market, though higher cap rates sometimes come with higher maintenance costs on older or distressed properties. Your target depends on your risk tolerance and investment goals.
How do you calculate NOI for an Albuquerque investment property?
You start with annual gross rental income and subtract all operating expenses: property taxes (New Mexico averages 0.67%), insurance, maintenance reserves (typically 1% to 2% of property value), vacancy loss (5% to 8%), and property management fees (8% to 10% of gross rent). The result is your Net Operating Income.
What is the difference between cap rate and cash-on-cash return?
Cap rate measures the property's performance without considering financing. Cash-on-cash return measures your actual cash earnings relative to the cash you personally invested. A property can have a solid cap rate but a weak cash-on-cash return if debt service is high, which is common at today's 6% to 7% mortgage rates.
What is the median rent in Albuquerque in 2026?
The median rent in Albuquerque is $1,310 per month as of August 2026. However, this varies significantly by neighborhood. Nob Hill commands the highest at approximately $1,700 per month, while statewide the median for houses is approximately $1,633.
Can a distressed homeowner turn their property into a rental instead of selling?
You can, but the cash-on-cash math needs to work. If your mortgage payment, taxes, insurance, and maintenance exceed rental income, you will lose money monthly. We recommend running all three metrics (cap rate, cash-on-cash, and ROI) before making that decision.
What operating expenses should I include when analyzing Albuquerque properties?
At minimum, include property taxes, homeowner's insurance, maintenance reserves, vacancy allowance, and property management fees. In New Mexico, the average annual property tax bill is approximately $2,881. Do not forget to budget for capital expenditures like roof or HVAC replacement.
How does property appreciation affect ROI in Albuquerque?
Albuquerque prices are expected to appreciate 3% to 5% annually, supported by an ongoing housing shortage of 13,000 to 28,000 homes. Over five years, even moderate appreciation of 4% annually on a $400,000 property adds roughly $86,700 in equity gains, significantly boosting total ROI.
Is the Albuquerque housing market good for investment in 2026?
Yes. Albuquerque's cost of living runs about 4% below the national average, its median sale price is 11% lower than the national average, and the housing shortage supports price stability. With 2.40 months of supply and homes selling in a median of 13 days, demand remains healthy.
What Albuquerque ZIP codes have the lowest entry prices for investors?
ZIP code 87102 covering the downtown area has the lowest median home value at $241,332. Southeast Albuquerque also offers entry points in the mid-$200,000s. These areas offer the strongest gross yields but may require more hands-on management.
Should I sell my Albuquerque home to an investor or on the open market?
In most cases, listing on the open market yields a higher sale price. However, if time is critical or the property needs significant repairs, an investor sale can close faster. We help distressed homeowners evaluate both options by running the numbers from every angle.
The Bottom Line
You now have the three formulas you need to evaluate any Albuquerque investment property: Cap Rate for quick comparisons, Cash-on-Cash Return for real-world cash flow analysis, and ROI for the full picture including equity and appreciation. Whether you are exploring investment opportunities or you are a homeowner trying to understand what your property is worth to buyers, these numbers put you in a position of strength.
If you are navigating a tough situation with your Albuquerque property, or if you are ready to analyze your next investment, we are here to help. We are Jenn and Vinay Rodgers with The Rodgers Neighborhood Real Estate Group, and we have spent over 12 years helping New Mexico homeowners make confident, data-driven decisions. Contact us at 505-417-2733 or visit us at 4800 Juan Tabo Blvd NE, Ste D, Albuquerque, NM 87111. Every conversation starts with understanding your numbers, and we will walk you through every single one.
Categories
- All Blogs (362)
- 2026 & Beyond for Real Estate (256)
- Doctors and Nurses looking for homes in NM (4)
- Guide to buying a home in NM (160)
- Health Care Heros (7)
- Home Upgrades (42)
- Jenn & Vinay your Local Real Estate Experts! (124)
- Moving to Albuquerque (139)
- Neighborhoods in Albuquerque NM (94)
- Rent or Own (2)
- Sellers Questions for Selling homes (2)
Recent Posts





GET MORE INFORMATION